If you work in an office, whether at home or on-site, there’s a good chance you spend most of your day staring at a computer monitor. And you may spend even more time in front of a monitor at home playing PC games, browsing the web, or working on a personal project.
That makes the quality of a monitor important. But how, exactly, should it be judged? PCWorld’s experts have poured years of expertise into tackling this problem. We mix real-world use with objective measurements to find the best computer monitors.
Our mission statement
Before we delve into the tests, it’s important to state that we evaluate computer monitors as computer monitors, and specifically consider their use with Windows PCs. While televisions, computer monitors, smartphones, and tablets all have displays, the qualities and features each must deliver are different.
We believe clarity and accuracy are the most important characteristics for a computer monitor. A vivid, alluring, and dynamic image is also important, and most computer monitors manage to achieve both simultaneously. We also heavily weigh features that impact day-to-day usability, like the monitor’s connectivity, how its features are accessed, and any special image modes it might have, such as Picture-by-Picture or Picture-in-Picture modes.
Mattias Inghe
Objective image quality tests: Contrast, color, and more
Image quality is critical for every computer monitor, but it’s impossible to accurately measure with the naked eye. We use the Datacolor Spyder X2 Ultra colorimeter to test a monitor across several dozen tests, which we pool together in several broader categories.
Brightness
Brightness takes the lead and, as you might expect, it measures a monitor’s maximum brightness. This is best understood as a measurement of comfort in bright rooms, and a higher result is better.
A monitor with a low maximum brightness might look dim in a bright room, which makes it less comfortable to view. We like to see at least 300 nits from a monitor, and 400 nits or more is ideal.
Contrast ratio
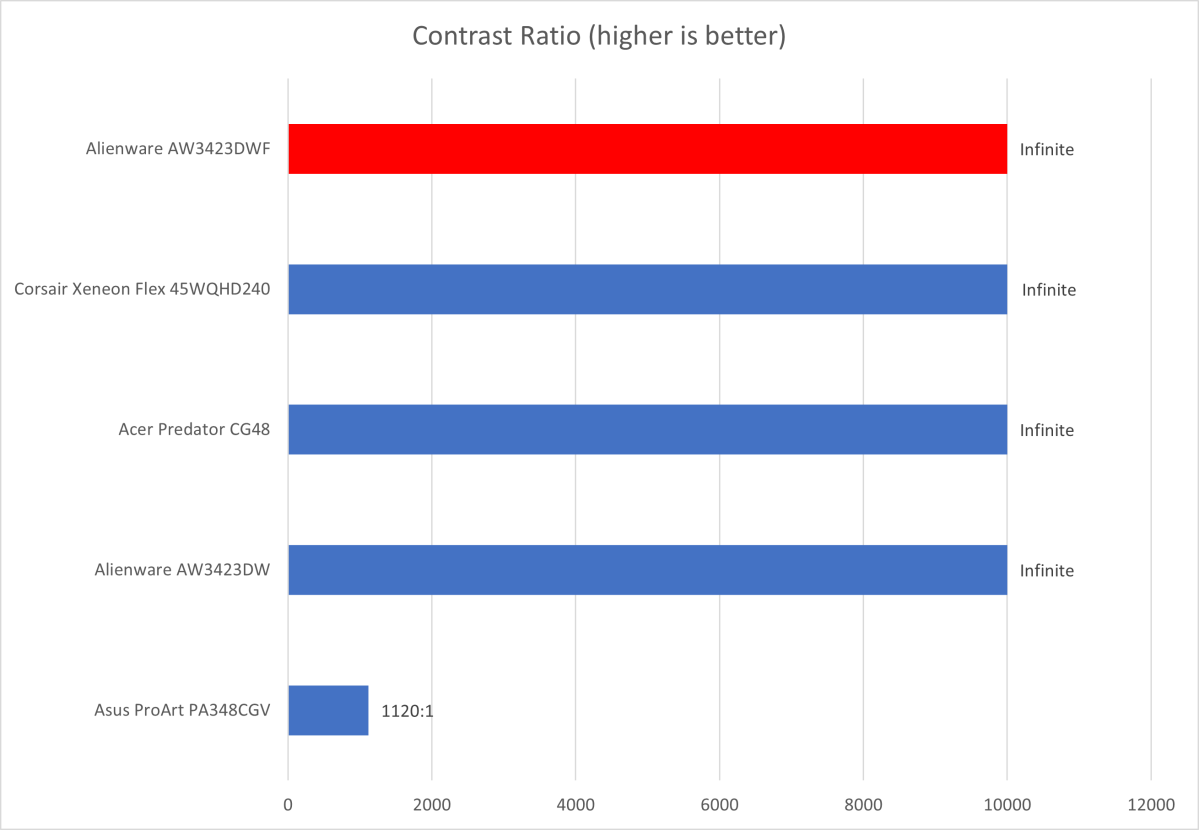
Contrast ratio, commonly shortened to contrast, is influenced by a monitor’s maximum and minimum brightness, it’s best understood as a monitor’s ability to handle dark scenes. A higher contrast ratio is better than a lower contrast ratio.
Contrast ratio is calculated by comparing a monitor’s maximum and minimum brightness to describe the range of brightness it can display. If a monitor has a maximum brightness of 300 nits, and a minimum of .1 nits, then it has a contrast ratio of 3000:1 (the maximum brightness of 300 nits is divided by the minimum brightness of .1 nits).
A higher contrast ratio creates a more immersive experience with plenty of detail in dark scenes. Contrast is extremely important when enjoying movies, games, streaming, and other entertainment.

Matt Smith
Color gamut
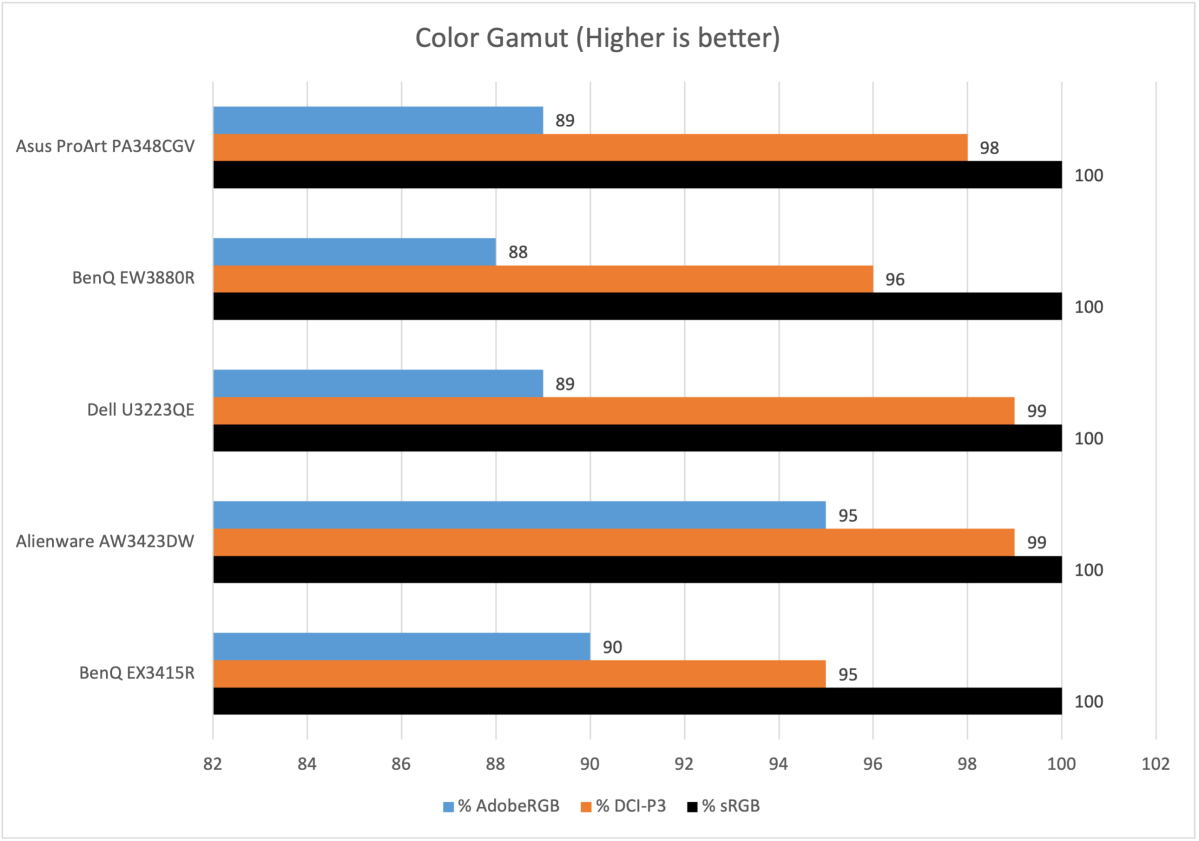
A monitor’s color gamut describes its ability to display the full range of colors in a particular color space. A color space is a standardized range of color created by an organization or company.
A variety of color spaces exist, but PCWorld reports results for three common color spaces relevant to computer monitors: sRGB, DCI-P3, and AdobeRGB. Color gamut is reported as a percentage of the color space a monitor can display, and a higher percentage is better.
For most people, gamut is best understood as a monitor’s vibrance and color brilliance. Monitors with wider color gamut performance look more saturated and dynamic than those with a narrower color gamut, which look dull by comparison. The difference is especially noticeable in movies and games.
Some professional content creators need a monitor that achieves a specific percentage of a particular color space, or better. A monitor with less than 100 percent coverage of a color space is literally incapable of displaying some colors in that space. That’s why creators often require a monitor with superb color gamut performance.

Matt Smith
Color accuracy
Color accuracy describes a monitor’s ability to accurately reproduce the color input to it from a source. It’s described as DeltaE, or color error. Unlike other tests, in this test a lower number is better. The error we report is the average error across 12 colors.
In most cases, better color accuracy leads to a more immersive and realistic image. A monitor with great color accuracy with show movies, photos, games, and other content as their creator intended. A monitor with bad color accuracy, on the other hand, will skew colors noticeably.
Content creators often need great color accuracy to ensure the content they’re viewing and working on will look the same on other monitors.
Color temperature and gamma
We also test color temperature and gamma, although we don’t report these results on a graph.
Color temperature describes how warm or cool a monitor’s display appears. Lower numbers look more warm and red, while higher numbers look more cool and blue. We measure color temperature with a white test image, and we expect a balanced color temperature of 6500K.
The technical details of gamma are beyond this article, but the takeaway is this: A lower gamma number will lead to lower contrast but may preserve more shadow detail, while a higher gamma number will lead to improved contrast but could cause a loss of detail in some dark areas. We prefer to see a gamma value of 2.2, which is the value modern computer applications most commonly target.
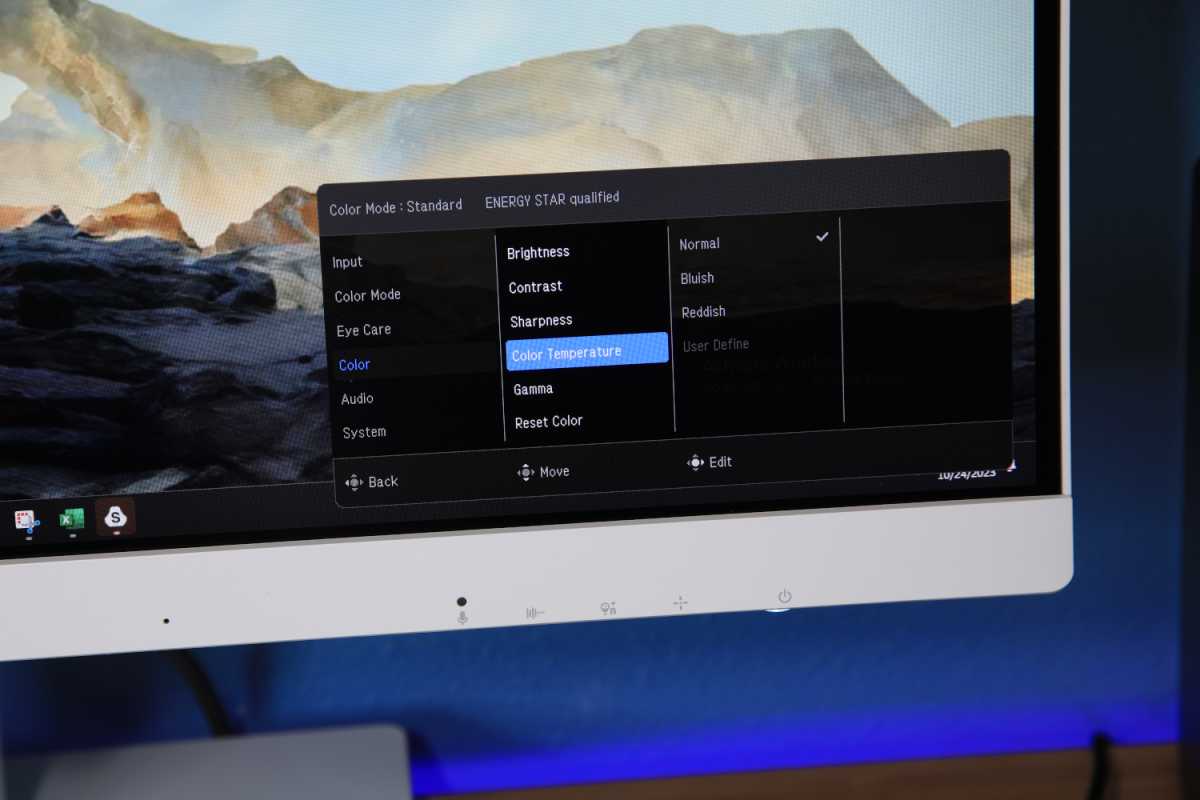
It’s important to understand that color temperature and gamma, unlike other metrics, don’t describe objectively better or worse image quality. While a color temperature of 6500K and a gamma value of 2.2 are our preferred values, some people like a lower, warmer color temperature, or the more contrast-rich look of a high gamma curve. The best monitors have multiple color temperature and gamma settings that let users choose their preference, and we note when a monitor supports this.

The BenQ GW2790QT’s menu system offers some customization options.
Matt Smith
Sharpness
Sharpness describes a monitor’s pixel density, which we report in pixels per inch. A higher pixel density looks sharper.
A monitor’s sharpness is related to its resolution, but it’s not the same. Sharpness is a better metric than resolution because it accounts for display size. 3480×2160 resolution (or 4K) resolution usually looks sharp but, if blown up to a 65-inch display, it leads to a pixel density far below a 27-inch 1080p computer monitor. That’s why large TVs aren’t great computer monitors.
HDR tests
Standard Dynamic Range, or SDR, is by far the predominant standard among modern PCs. Windows supports HDR, but many apps do not, and image quality problems can arise when viewing SDR and HDR apps together. That’s why our tests focus on SDR.
HDR is relevant, though, especially when playing games or watching movies. We test HDR brightness and contrast with a test clip that can achieve a maximum luminance beyond 1,000 nits. The brightness and contrast are reported and, as with SDR, higher values are better.
We also use several clips to judge a monitor’s subjective HDR performance. These include the “Gargantuan” scene from Interstellar and the “Into the Sand Storm” scene from Mad Max Fury Road. For gaming, we typically use Forza Horizon 5, though we also view other games that are popular at the time the monitor is reviewed.
Motion clarity
A monitor’s motion clarity describes its ability to preserve the clarity, sharpness, and detail of an image when it’s in motion. It’s most important for games played at a high frame rate but also improves clarity and fluidity on the Windows desktop.
While objective measurements of motion clarity exist, the results of these tests are difficult to understand. We instead report subjective results from several tests found on Blur Busters. These include the UFO, Video Game Motion, and Vertical Scrolling tests. We consider whether small objects are identifiable, the amount of detail retained in fine elements (such as a texture in a game, or the windows in a building), and the legibility of text as it scrolls across the display.
We also report any distractions that appear, like a “double image” effect, streaking, halos, or artifacts around or behind objects.
Design and features
Our objective image quality tests are focused on the nuances and details that distinguish one monitor from another. However, these tests are not the only factors we consider important. We also consider the subjective design and features of each monitor.
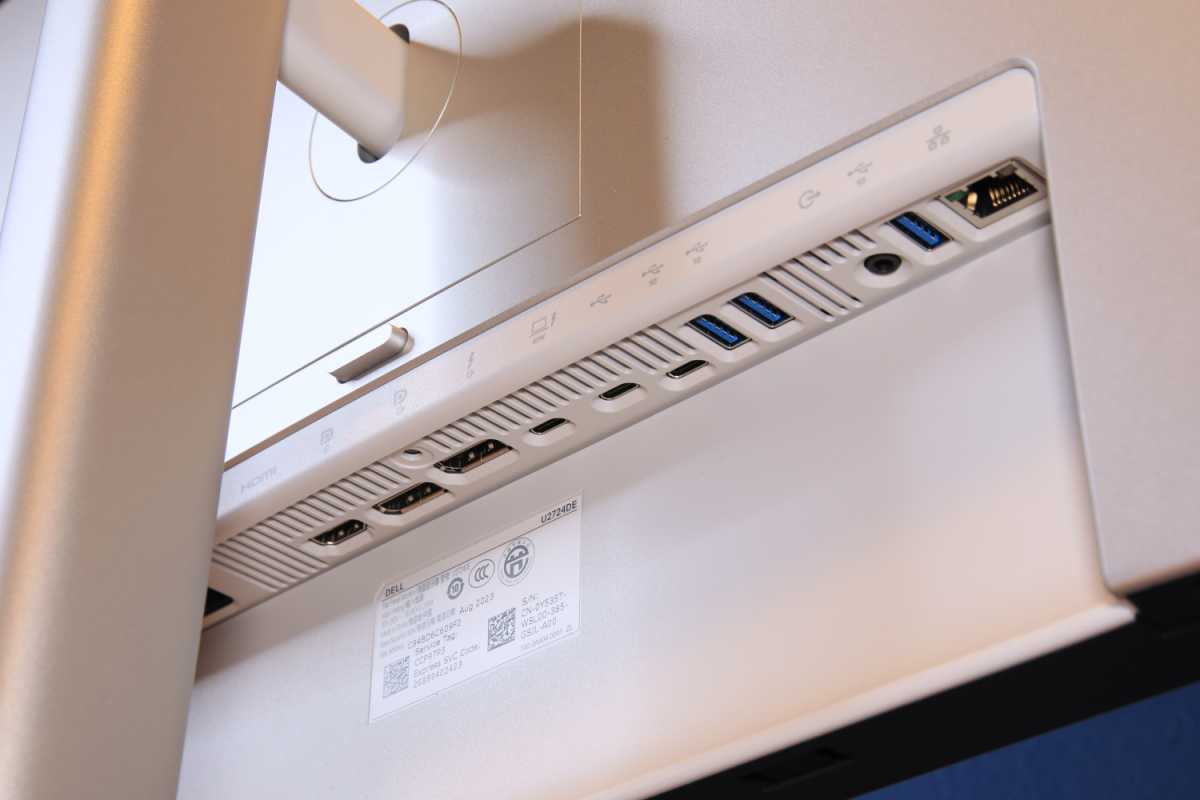
This includes factors such as a monitor’s build quality, connectivity options, on-screen menu, and special display modes, like Picture-by-Picture mode, as well as support for adaptive sync technology. The importance of each depends on a monitor’s price and intended purpose.
While we can’t objectively test most of these features in the same way we would test image quality, that doesn’t mean they are less important. For monitors, especially in categories such as office monitors, these features can actually be more crucial than image quality.
It’s entirely possible for a monitor with inferior image quality to earn a higher score if it has many useful features. USB-C monitors are a good example: For these monitors, high USB Power Delivery and a wide range of downstream connectivity are key.

The connectivity features on the Dell U2724DE are extensive.
Matt Smith
Conclusion
Our comprehensive computer monitor tests give us excellent insight into the best monitors available right now, but we’re always looking to improve our testing and may include additional tests in future reviews.
We also encourage readers not to focus too heavily on any single test result or feature when buying a monitor. A computer monitor is arguably the most versatile single display in a modern home, capable of handling entertainment, work, and casual use with equal ease. The best monitors aren’t specialists but instead jacks-of-all-trades that excel in one or two areas.


