Companies are engaged in a seemingly endless cat-and-mouse game when it comes to cybersecurity and cyber threats. As organizations put up one defensive block after another, malicious actors kick their game up a notch to get around those blocks. Part of the challenge is to coordinate the defensive abilities of disparate security tools, even as organizations have limited resources and a dearth of skilled cybersecurity experts.
XDR, or Extended Detection and Response, addresses this challenge. XDR platforms correlate indicators from across security domains to detect threats and then provide the tools to remediate incidents.
While XDR has many benefits, legacy approaches have been hampered by the lack of good-quality data. You might end up having a very good view of a threat from events generated by your EPP/EDR system but lack events about the network perspective (or vice versa). XDR products will import data from third-party sensors, but data comes in different formats. The XDR platform needs to normalize the data, which then degrades its quality. As a result, threats may be incorrectly identified or missed, or incident reports may lack the necessary information for quick investigation and remediation.
Cato’s Unique Approach to Reducing Complexity
All of which makes Cato Networks’ approach to XDR particularly intriguing. Announced in January, Cato XDR is, as Cato Networks puts it, the first “SASE-based” XDR product. Secure Access Service Edge (SASE) is an approach that converges security and networking into the cloud. SASE would seem to be a natural fit for XDR as there are many native sensors already in a SASE platform. Gartner who defined SASE in 2019 talks about a SASE platform including “SD-WAN, SWG, CASB, NGFW and zero trust network access (ZTNA)” but those are only the required capabilities. SASE may also include advanced security capabilities such as remote browser isolation, network sandboxing, and DNS protection. With so many native sensors already built into the SASE platform, you could avoid the biggest problem with XDR – the lack of good data.
Cato SASE Cloud is the prototypical example of what Gartner means by SASE and, on paper at least, Cato XDR would tap the full power of what SASE has to offer goal. The Cato SASE Cloud comes with a rich set of native sensors spanning the network and endpoint — NGFW, advanced threat prevention (IPS, NGAM, and DNS Security), SWG, CASB, DLP, ZTNA, RBI, and EPP/EDR. The latter, EPP/EDR, is just as new as Cato XDR. Cato EPP is built on Bitdefender’s malware prevention technology and stores customer and endpoint data in the same data lake as the rest of the Cato SASE network data. XDR users end up with an incredibly rich “surround sound” view (pardon the mixed metaphor) of an incident with detailed data gathered from many native sensors. Cato’s capabilities are instantly on and always available at scale, providing a single shared context to hunt for, detect, and respond to threats. For those who have their own EPP/EDR solutions in place, Cato can work for them as well. Cato XDR integrates with leading EDR providers such as Microsoft Defender, CrowdStrike, and SentinelOne.
Testing Environment
The review is going to focus on a day in the life of a security analyst using Cato XDR. We’ll learn how an analyst can see a snapshot of the security threats on the network and the process for investigating and remediating them. In our scenario, we’ve been informed of malware at 10:59 PM. We’ll investigate and then remediate the incident.
It’s important to understand that Cato XDR is not sold as a standalone product, but as part of the larger Cato SASE Cloud. It leverages all capabilities – sensors, analytics, UI and more – of the Cato SASE Cloud. So, to fully appreciate Cato XDR, one should be familiar with the rest of the Cato platform to best appreciate the simplicity and – what Cato calls “elegance” – of the platform. But doing so would make it difficult, if not impossible, to have room to review Cato XDR. We chose to take a cursory look at Cato overall but then focus on Cato XDR. (You can see a more complete albeit outdated review of the platform from back in 2017.)
Getting into Cato XDR
As we enter the Cato SASE Cloud platform, they’re greeted with a customized view of the enterprise network. Security, access, and networking capabilities are available from pull-down menus across the top and dashboards and specific capabilities for investigation, detection, and response, and practices assessments down the vertical. Accessing Cato XDR is under the Detection & Response section. To explore Cato XDR capabilities, visit Cato XDR.
 |
| Cato XDR is accessible from the left-hand side of the screen (indicated by the red box). Note: topology shown does not reflect our test environment. |
Putting Cato XDR to the Test
Clicking on the Stories Dashboard of Cato XDR gives us an overall view of the stories in the enterprise (see below). A “story” for Cato is a correlation of events generated by one or multiple sensors. The story tells the narrative of a threat from its inception to resolution. The first thing we noticed is that the Stories Dashboard has an intuitive and easy-to-use interface, making it simple to navigate and understand for security analysts of varying skill levels. We feel this is crucial for efficient investigations and decision-making.
To get a quick understanding of the overall risk score of the account, we looked at the AI-powered Account Risk Score widget. In this case, the overall risk score is 75—so, fairly high. This tells us we need to dig in and see what’s leading to such a high score. There are 55 incidents stories in all, 24 of which are open and 30 of which are closed.
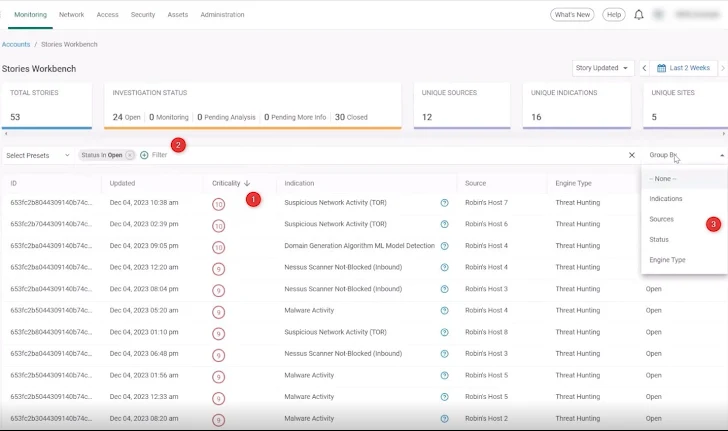
Below the overall summary line, we have widgets help us understand our stories from different perspectives. The highest priority stories are sorted by an AI-powered criticality store (1). The score is based on all the story risk scores for the selected time range and is calculated using a formula developed by the Cato research and development team. This is helpful in telling us which stories should be addressed first. We can also quickly see the hosts (Top 5 Hosts) and sites (Top 5 Sites) involved in the most stories (2). Scrolling down we see additional graphs capturing the story breakdown by criticality (3); Indicator of Attack (IoA) such as Malware Activity, Domain Generation Algorithm (DGA), and Suspicious Network Activity (4); and MITRE ATT&CK techniques, such as Application Layer Protocol, Exfiltration Over C2 Channel, and Automated Exfiltration Mitigation (5).
As analysts, we want to see which stories are open. A click on the 24 open stories in the summary line of the Stories Dashboard brings us to the Stories Workbench page (also accessible from the navigation on the left-side of the screen), which displays a prioritized list of all stories for efficient triage and better focus. Cato uses an AI-powered Criticality score to rank the stories (1). We can also add more filters and narrow down the list even further to enable better focus in the filter row (2). Grouping options also enable easier analysis (3).
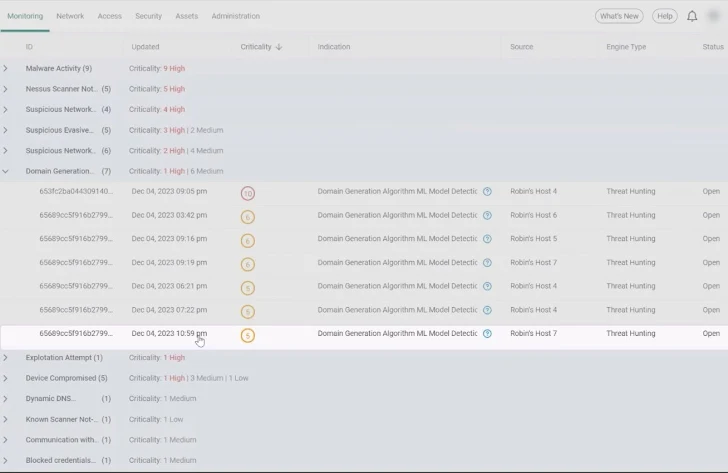
We decided to examine the distribution of threats in the Stories Workbench screen by grouping threats by their Unique Indications. Now, we can see threats by category — Malware Activity, Suspicious Network Activity, Domain Generation Algorithm (DGA), and so on. DGA is a technique used by malware authors to dynamically generate many domain names. This is commonly employed by certain types of malware, such as botnets and other malicious software, to establish communication with command-and-control servers. We went to the final story at 10:59 PM and opened it for investigation.
 |
| The Stories Workbench screen grouped by indications, showing the stories with domain generation algorithms (DGAs). We investigated the final DGA story. |
The investigation screen shows a methodological process with tools for analyzing threats from the top down, gaining a high-level understanding of situation and then delving deeper into the investigation. First is the summary line of the story (1). We can see that the type of attack detected is Domain Generation Algorithm, that this is a threat-hunting story, and that the number of Associated Signals, which are the network flows that make up the story, is 26. Threat hunting stories contain correlated security events and network flows and using AI/ML and Threat Hunting heuristics to detect elusive signatureless and zero-day threats that cannot be blocked by prevention tools.
We can see that the story duration is nine days, indicating that we found Associated Signals within a time span of nine days, and of course, that the status of the story is open. Next, we see the status line, which records the actions that took place in the story (2). Currently, we see that the status was “created.” Additional actions will be added as we work on the story. Moving on to the details, we can quickly see that the Domain Generation Algorithm, or DGA, was found on Robin’s Host 7. We see that the attack direction is outbound, and the AI-powered criticality score is 5.
For an easy-to-read understanding of the story, we can click on the “See Summary” button. Cato’s Gen AI engine summarizes the results of the screen in easy-to-read text. Details include the type of communication, the IP source, the targets, why the story was detected, and if any actions were taken automatically, such as blocking the traffic.
 |
| Clicking on the “Story Summary” button (1) generates a textual summary of the screen using Cato’s Gen AI engine. |
Closing the Story Summary and staying on the investigation screen, we gain additional insights about the story. Cato’s machine learning-powered Predicted Verdict analyzes the various indicators in the story and based on previous knowledge provides an expected verdict (1). Another smart insight is the “Similar Stories,” which is also powered by AI and, when relevant, will link to stories with similar characteristics. There’s also the Playbook Knowledge Base (highlighted) to guide us on how to investigate stories of Malicious Target Communication.
On the right side of the screen, we can see the source details (2): the IP, the OS, and the client. We see that this is a Tor browser, which can be suspicious. Tor is a web browser specifically designed for privacy and anonymity, and attackers often use it to conceal their identity and activity online.
We can see the attack geolocation source (3), which communicates with different countries on different parts of the map. This can also be suspicious. Next, we look at the Target Actions box (4) where we can see actions that relate to every target involved in this story. Since this is a threat-hunting story, we can see a correlation between a broad set of signals.
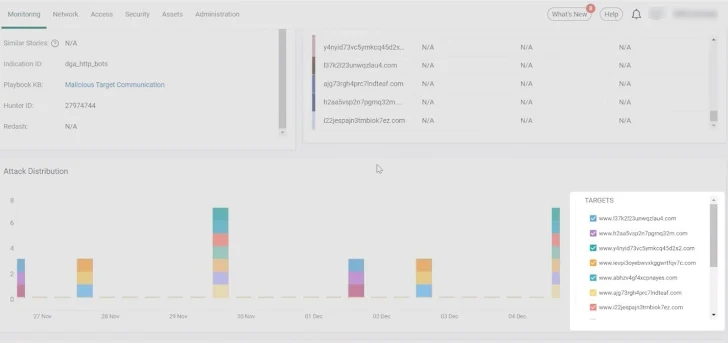
Scrolling down we examine the attack distribution timeline. We can see here that the communication to the targets has been going on for nine days.
By filtering out some of the targets, we can see patterns of communications, which are easily observable. We clearly see a periodic activity that is indicative of bot- or script- initiated communication. Under the attack timeline, the Targets table (1) provides additional details about the targets, including their IPs, domain names, and related threat intelligence. The targets are sorted by malicious score. This is a smart score powered by AI and ML that takes all of Cato’s threat intelligence sources, both proprietary and third party, and calculates the score between zero and one to indicate whether the IP is considered highly malicious or not.
The popularity column shows if the IP is “popular” or “unpopular” as determined by Cato’s proprietary algorithm measuring how often an IP or domain is visited according to Cato internal data. Unpopular IPs or domains are often indicative of suspicious IPs or domains. We can gain external threat intelligence information about the target by clicking third-party threat intelligence links such as VirusTotal, WhoIs, and AbusePDB.
 |
| External threat intelligence sources are just a click away from within the Targets table. |
Scrolling down to the Attack Related Flows table, we can view more granular details about the raw network flows that compose the story, such as the start time of the traffic and the source and destination ports. In this particular case, the destination ports are unusually high (9001) and less common, which raises a red flag.
Documenting What We Found with Cato
Let’s summarize our findings from our test case. We found suspicious network activity related to domain generation algorithm that uses the Tor client. The IP has low popularity, high malicious scoring, and the communication follows a specific pattern in distinct times. So, we can now reach a conclusion. We suspect that there is a malware installed on the source endpoint, Robin’s Host 7, and that it’s trying to communicate outside using Tor infrastructure.
Now let’s set up the verdict in the screen below. We’ll classify the story as malicious. The analyst severity would be medium. The type is anonymizer. We can see the details in the image below. The classification would be DGA. Then we can save the verdict on this incident story.
 |
| The security analyst can document a verdict to help others understand the threat. |
Once saved, we can see that that opening threat hunting screen has been updated. The second row now shows that the analyst has set the severity to Medium, and the verdict is set to malicious. Now the response would be to mitigate the threat by configuring a firewall rule.
Mitigate The Threat with Cato
Normally, analysts would need to jump to another platform to take action, but in the case of Cato it can all be done right in the XDR platform. A block rule can be easily created in Cato’s Internet firewall to prevent the spread of the malware. We copy the target domain that appears in the attack network flows, add the domain to the App/Category section of the firewall rule, and hit apply. Worldwide the DGA domain is now blocked.
 |
| The updated Cato firewall screen with the rule blocking access to the DGA-generated domain. |
Conclusion
With its introduction of SASE-based XDR, Cato Networks promised to vastly simplify threat detection, incident response, and endpoint protection. They appear to uphold the promise. The test case scenario we ran through above should take an experienced security analyst less than 20 minutes from start to mitigation. And that was with no setup time or implementation or data collection efforts. The data was already there in the data lake of the SASE platform.
Cato Networks has successfully extended the security services of its unified networking and security platform with XDR and related features. This is a huge benefit for customers who are determined to up their game when it comes to threat detection and response. Want to learn more about Cato XDR? Visit the Cato XDR page.


